

The controls and labels below apply to Hiddify Windows 4.1.1. The reference screenshots use the Chinese interface, so the corresponding labels are included where they help you locate a control. Other versions may place these controls elsewhere.
Find the relevant Hiddify logs, step by step
A useful log excerpt connects one action to the records produced at roughly the same time. Do not begin by clearing the existing log: the Clear button removes the core log file and the records currently displayed, including evidence you may not have saved.
- Open Logs and remove display filters. Select Logs (日志) in the left sidebar. Delete any text in the Filter (筛选) field, then choose All (全部) from the level menu. If log updates are paused and a triangular resume icon is visible, select it before reproducing the problem. If the pause icon is already visible, updates are running and no switch is needed.
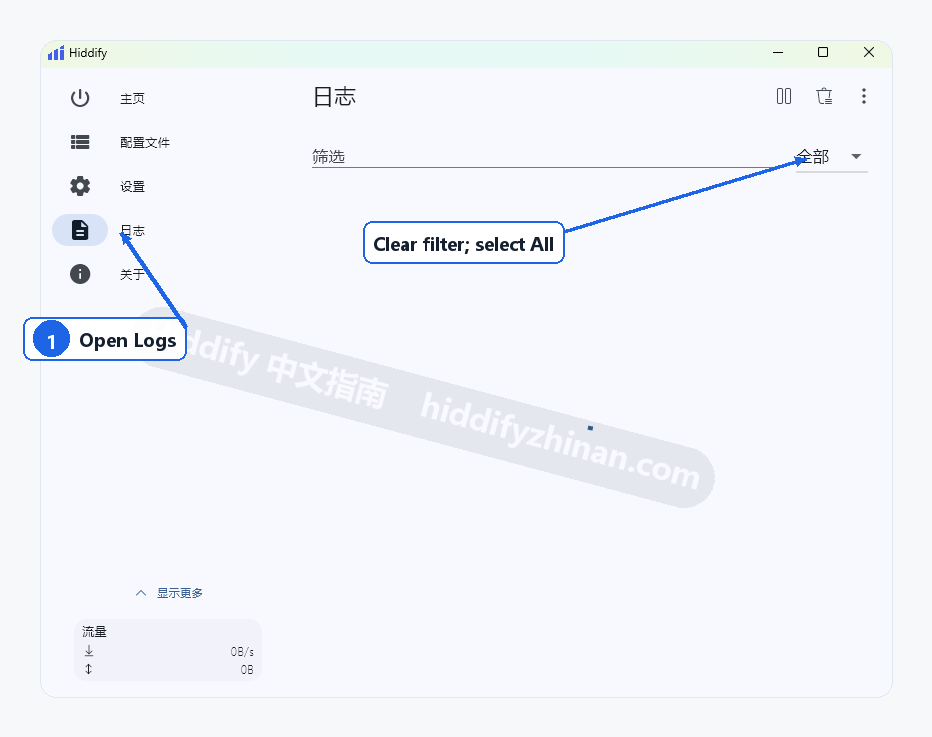
- Reproduce one specific problem and note the time. Return to the action that failed, such as starting a connection or opening a particular destination, and perform it once. Record what you did, the approximate time, and what happened on screen. A precise description such as “selected Connect at 14:32, but the destination kept loading” is more useful than “Hiddify did not work.”
- Return to Logs and pause the display. Select the pause icon at the upper right after the failure occurs. In version 4.1.1, pausing stops new records from moving through the display; it does not disconnect Hiddify. This gives you a stable section to read.
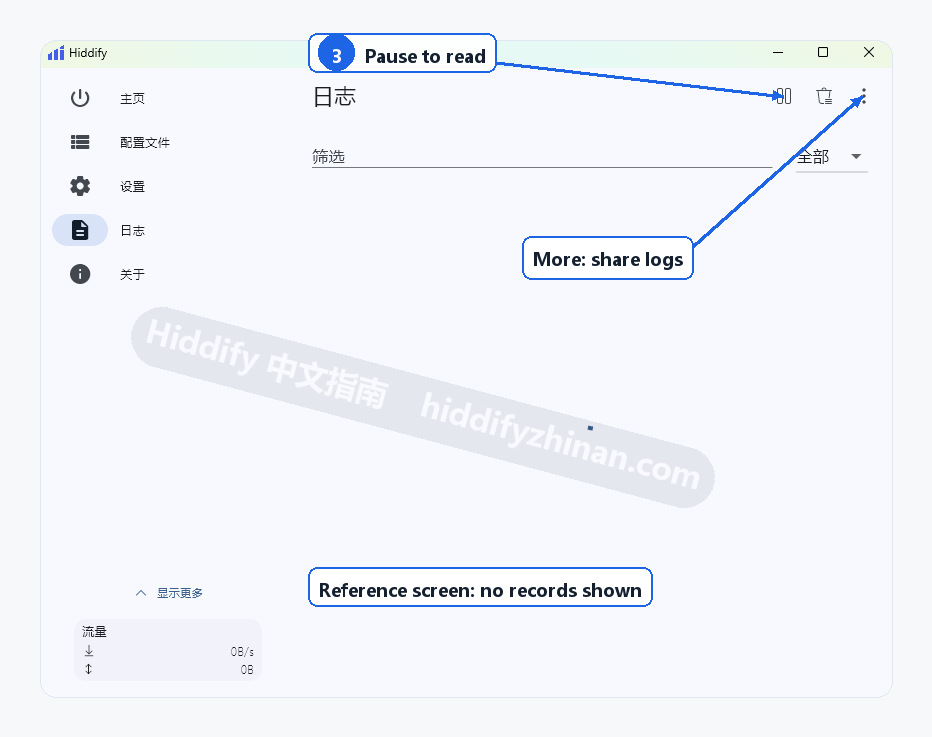
- Collect the nearby records with their context. Start with lines from the same time as the failed action. Keep enough surrounding lines to show which component or request was involved, what happened immediately before the error, and what followed it. Preserve the error type while removing private values before sharing anything.
The goal is not to prove a root cause from one line. It is to produce a short, coherent sequence that another person can compare with the action and visible symptom.
Read the action and context before the error label
An error level tells you that something reported a problem; it does not identify the affected task by itself. Read the record’s object or component, its time, and the action you had just performed before interpreting words such as ERROR or timeout.
For example, suppose a record near 14:32 contains the word timeout. That hypothetical word is a clue, not a diagnosis. Check what timed out and whether it aligns with the connection or destination you tried at 14:32. A timeout associated with one request cannot, on its own, prove that an entire subscription expired, a service was blocked, or every proxy stopped working.
The text filter in Hiddify 4.1.1 performs a case-sensitive match against the log text. When narrowing a busy display, copy a distinctive term with its original capitalization rather than retyping it from memory. Clear the field again if the result unexpectedly becomes empty.
The level menu controls what the page displays. All removes the level filter; choosing another level shows that level and records of higher severity. This changes which existing records you can see. It does not create records that were never logged.
When the log area is empty or no longer updating
An empty page can mean that the display is paused, a text or level filter hides the available records, or the relevant action has not produced a visible record yet. It does not establish that the connection is healthy or that no failure occurred.
Check the display in this order:
- If a triangular resume icon is visible, select it to resume updates.
- Remove all text from Filter (筛选) and choose All (全部).
- Reproduce the specific action once while updates are running, then return to Logs.
- Pause only after the action has occurred, and inspect the records around the noted time.
Do not clear unsaved records while trying to restore the display. Also avoid treating a switch to a more detailed debug level as a universal fix: All exposes the levels already present, but it cannot add information that was not recorded.
If the visible problem is an empty node list rather than a logging issue, follow the guide to fix an empty Hiddify proxy list. If Hiddify connects but traffic still cannot reach its destination, use the steps to troubleshoot a Hiddify connection that cannot reach the internet. Those pages handle the failed tasks; this page explains how to preserve the records that describe them.
Prepare a useful, redacted support request
The three-dot menu on Hiddify Windows 4.1.1 provides Share Core Logs (分享核心日志) and Share App Logs (分享应用日志). The Logs page primarily displays core records, while app logs are separate. Choose the set that matches the problem you are reporting. The operating system handles the resulting file or directory, so the next save or share window may differ between systems.
Before sending anything, assemble a small support package:
- State the environment. Include the operating system and Hiddify version, such as “Windows 11, Hiddify 4.1.1.”
- Describe the exact action and symptom. Name the control or destination involved and explain what appeared to fail. If routing mode matters to the report, identify it; the guide to choosing between TUN and System Proxy explains that distinction.
- Give the approximate failure time. Use the same time you matched against the records.
- Select only the relevant excerpt. Include the related line and enough preceding or following context to show what the program was doing. Do not send a full log without explaining which event matters.
- Redact private data. Remove complete subscription URLs, tokens, account identifiers, and any IP addresses or domain names you do not want to disclose. Keep the error type, timestamps, component names, and surrounding structure needed to understand the sequence.
The Share command is a file-sharing route, not an automatic redaction tool. Open or inspect the material before it leaves your device. If a private value appears inside a useful line, replace only that value with a marker such as [REDACTED_TOKEN] rather than deleting the entire error and its context.
A concise request can use this template:
System and version: Windows 11, Hiddify 4.1.1
Action: [the control selected or destination requested]
Approximate time: [local time]
Observed symptom: [what happened on screen or in the target app]
Relevant records:
[several redacted lines from the same time]
Private values removed: subscription URL, token, account ID, private IP/domain as applicable
This is a reporting template, not a sample of a tested failure. Its purpose is to keep the symptom, time, and records tied to the same event. More task-focused articles are available in the Hiddify guides.
Frequently asked questions
Does pausing the logs disconnect Hiddify?
No. In Hiddify 4.1.1, the pause control stops updates to the log display and does not call the connection-disconnect action. Select the triangular resume icon when you need to see newly arriving records again.
Does an ERROR mean my subscription has stopped working?
Not by itself. Read what produced the error, what action occurred at that time, and what actually failed for the user. One ERROR line may concern a particular request or component; it cannot alone establish that the whole subscription has stopped working.
Why does All still show no detailed records?
All removes the level filter from the records already available. It does not generate earlier or more detailed data. Check whether updates are paused, clear the case-sensitive text filter, and reproduce the specific problem once. Changing to a debug level is not a required general-purpose step.
Do I need to check a log file before using Share?
Yes. The sharing options do not automatically remove private information. Inspect the material for complete subscription links, tokens, account identifiers, and private IP addresses or domains. Share the relevant redacted excerpt together with the action, time, version, and visible symptom.
Make the records tell the same story as the problem
Useful Hiddify logs are not simply the largest file or the line with the strongest error label. They are the records that line up with a named action, an approximate time, and an observable failure. Opening Logs without filters, reproducing one event, pausing to read, and preserving nearby context creates that link.
A support request can then explain when the action happened, what failed, and which records accompanied it without exposing unrelated history or private credentials. That is enough to begin informed troubleshooting; it does not require one log line to reveal the entire root cause.
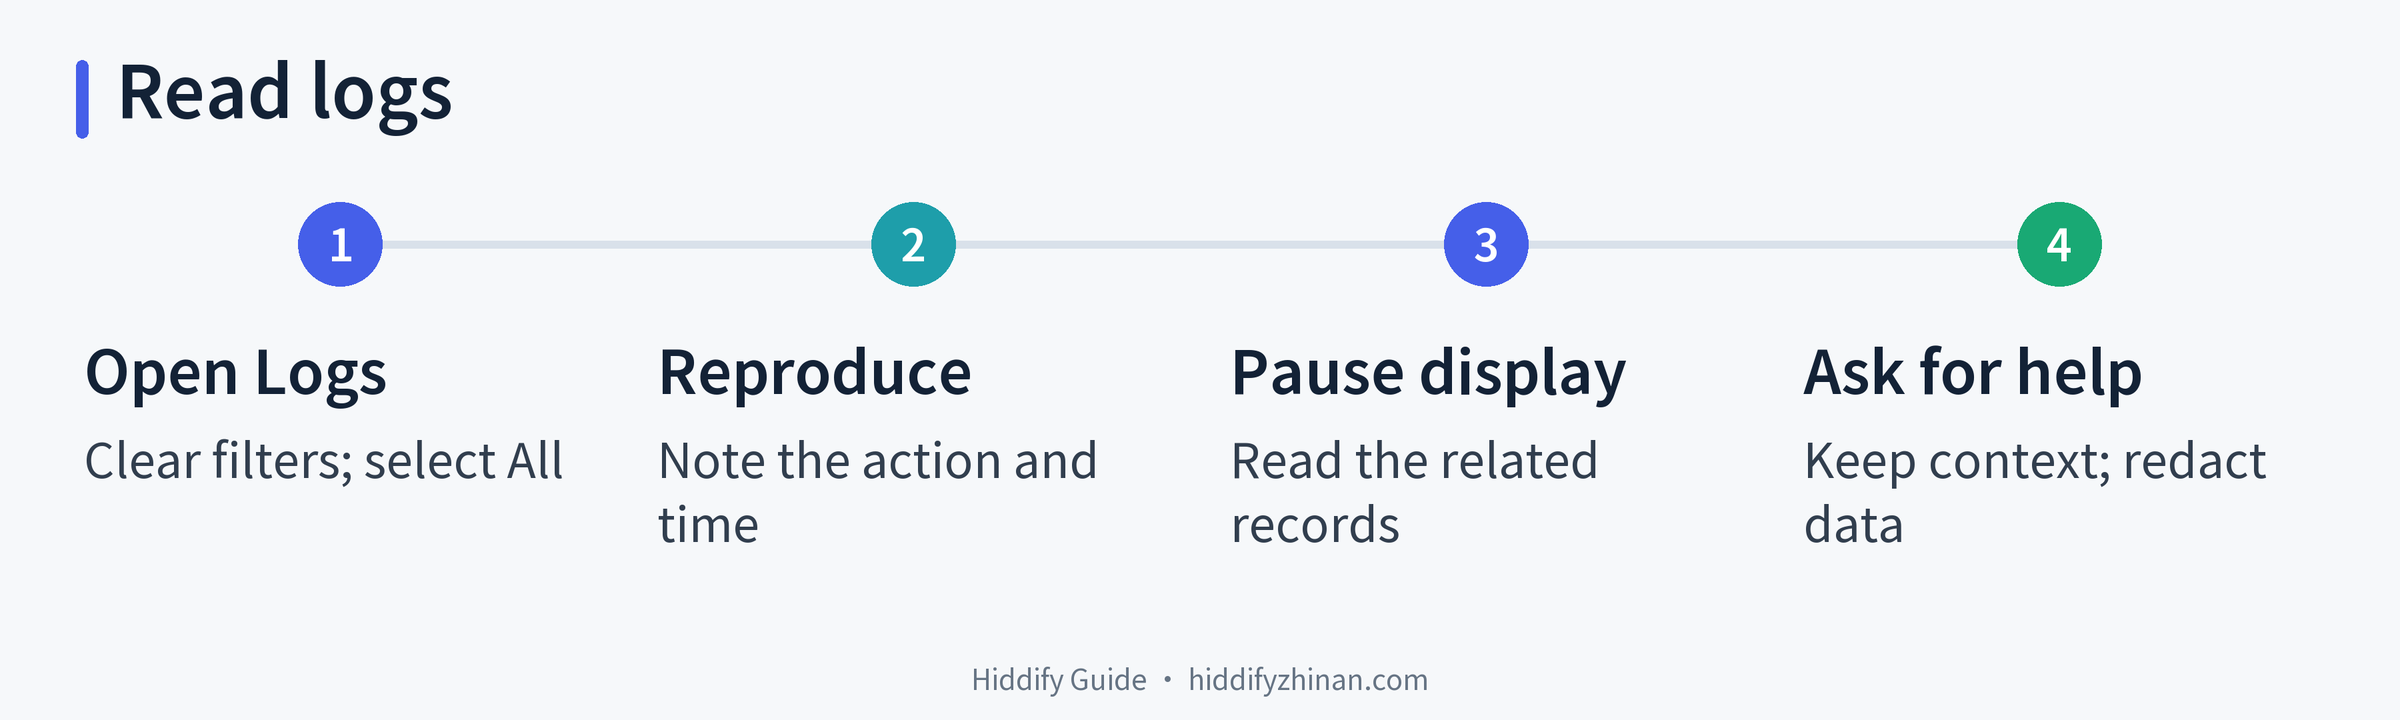
The four-stage recap keeps the task in order: expose the available records, recreate one clearly described event, hold the display at the useful moment, and ask for help with context intact and private values removed.
Source: Hiddify 4.1.1 Logs page implementation, reviewed 2026-09-16.